|
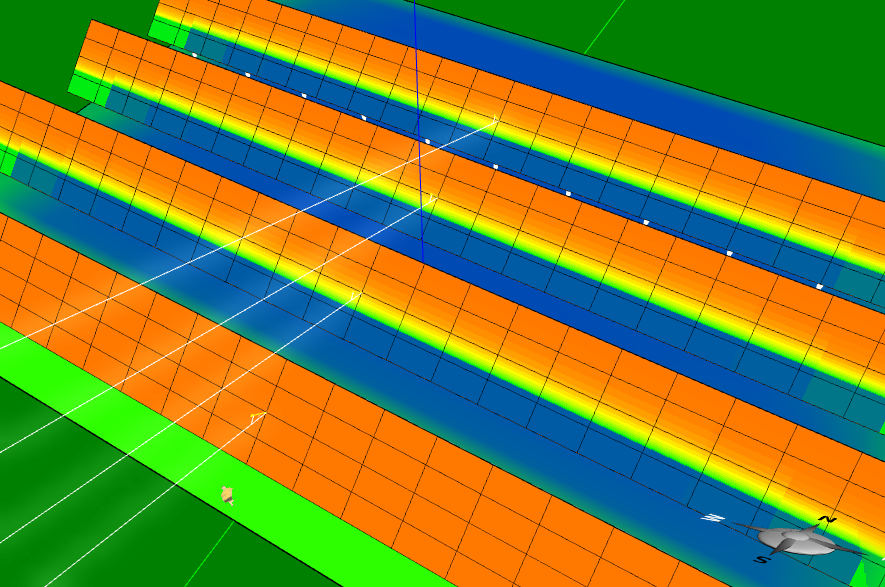
| Fig. 1: Inter-row shadowing (daily total) |
Designing a ground-mounted solar panel array is one of the challenges in our Solarize Your World curriculum, in addition to other challenges such as rooftop solar power systems, solar canopies, building-integrated photovoltaics, and concentrated solar power plants. With the support of our intuitive
Energy3D software, designing a solar panel array appears to be a small and simple job as students can easily add, drag, and drop solar panels to cover up a site with many solar panels. But things are not always as simple as they seem.
 |
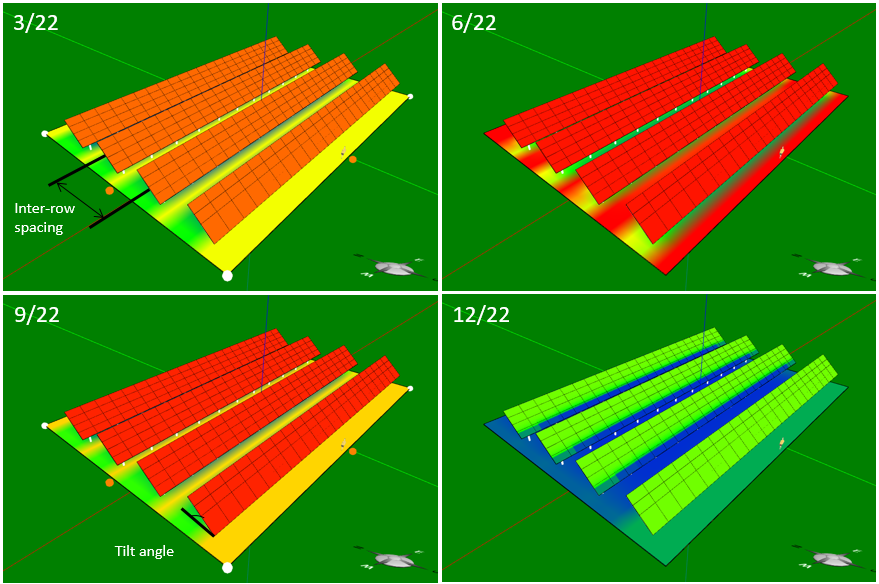
| Fig. 2: Solar radiation on an array in four reasons. |
The design of a photovoltaic solar farm is, in fact, a typical engineering problem that requires the designer to find a solution that generates as much electricity as possible with a limited number of solar panels on a given piece of land, among many other constraints and criteria. Such an engineering project mandates iterative design and optimization in a solution space that has scores of variables. And the more the variables we have to deal with, the more complicated the design challenge becomes.
 |
| Fig. 3: Annual outputs vs. row spacing and tilt angle |
This sequence of articles will walk you through the essential steps for designing photovoltaic solar farms under a variety of conditions. To get you started, let's assume that 1) we have a rectangular area for the solar farm; 2) the edges of the area are perfectly aligned with the north-south and east-west axes; and 3) the area is perfectly flat. This kind of site is probably uncommon in reality (unless the site is in a desert). But let's begin with a very simple scenario like this.
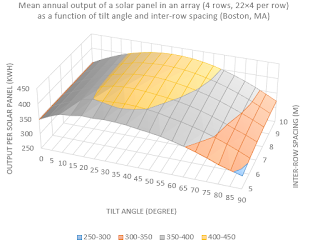 |
| Fig. 4: Surface plot of solar output (ideal) |
One of the first things that we have to decide is the number of solar panels. This is usually dictated by the budget. Suppose we have a fixed quantity of solar panels that we can install at a site large enough to space them (i.e., let's assume that we are not constrained by the area of the site for the time being). As people usually put solar panels on racks (a rack of solar panels is often referred to as a row -- but don't confuse it with the rows of solar panels you put on each rack), the next things we have to decide are 1) how many solar panels we want to place on each rack, 2) whether these solar panels are placed in "portrait" or "landscape" orientation on the rack, and 3) how long each rack is. From these information, we know the number of rows for the array. For example, the array in Figure 1 has four rows, each of which has 88 solar panels stacked up in a 4x22 landscape configuration. Since the shorter side of each panel is about one meter long, each rack is about four meters wide.
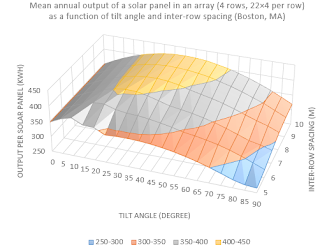 |
| Fig. 5: Surface plot of solar output (using bypass diodes) |
How far should the distance between two adjacent rows be? If the solar panels are tilted towards the sun, the rows cannot be too close to one another as the inter-row shadowing (Figure 1) will reduce the total output (sometimes severely, depending on the wiring of the solar cells on the solar panels -- we will investigate this in the
next article), but they cannot be too far away from one another, either, as a longer distance between rows will decrease the efficiency of land use. Determining the optimal inter-row spacing for the solar array under design depends on a number of confounding factors such as the tilt angles, location, solar cell wiring, time of year, use of trackers, type of inverters, and shape of the site that greatly complicate the problem (Figure 2). This is a case in which a thorough understanding of the domain knowledge
per se does not suffice to solve the problem. As there is no exact solution, we have to come up with a procedure and a strategy to search for an optimal one in the solution space. And, sometimes, this solution space can be so vast that manual search becomes infeasible.
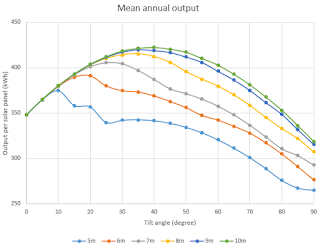 |
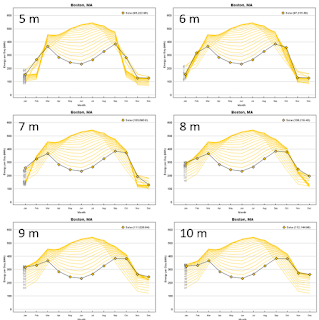
| Fig. 6: Line graph of solar output (using bypass diodes) |
To simplify the search for now, let's assume that we only have to decide on the optimal values for the tilt angle and the inter-row spacing. This assumption reduces the solution space to only two dimensions. The most straightforward way to nail them down is to gradually vary the tilt angle and the inter-row spacing and then compute the total annual output of the solar panels at each step (Figure 3), a tedious job that took me a couple of hours to do. Once we have the results, we can use Excel to create a surface plot that shows different zones of outputs as a function of the inter-row spacing and tilt angle (Figures 4 and 5 -- we will discuss their differences in
the next article; for now, you just need to know that Figure 5 is a more accurate result). The yellow zones in the surface plots are the reduced solution space where we should zero in to find our solution, taking trade-offs with other criteria such as the efficiency of land use into account. To have a clearer view, Figure 6 shows a 2D line graph of the solar
outputs as a function of the tilt angle for six values of inter-row spacing.
The conclusions are that a tilt angle that is approximately equal to the latitude of the site (about 42 degrees in the case of Boston, MA) is the best when the rows are relatively far apart (say, 10 meters away center-to-center or 6 meters way edge to edge when the tilt angle is zero) and when the rows become closer, a smaller tilt angle should be more favorable. For instance, with the center-to-center inter-row spacing reduced to 8 and 7 meters, 35 and 26 degrees are the optimal choices for the tilt angle, respectively. With the optimal tilt angles, we will lose about 2% and 4% of electricity output when we reduce the inter-row spacing from 10 meters to 8 meters and 7 meters, respectively. If we don't change the tilt angles, the losses will increase to 3% and 9%, respectively. These findings apply to fixed solar panel arrays that do not track or "
backtrack" the sun.
The analyses we have done so far just barely scratched the surface of the problem. We have many other design topics to cover and design factors to consider. But the volume of work thus far should speak aloud for itself that this is not a simple problem. At the same time Energy3D greatly simplifies an engineering task and empowers anyone to tackle it, it could also create an illusion as if engineering were simple. Yes, a What-You-See-Is-What-You-Get (WYSIWYG) 3D design and construction program like Energy3D may be entertaining in ways similar to playing with Minecraft, but no, engineering is not gaming -- it differs from gaming in many fundamental ways.